Two lines from the same bulletin
In July 2026 Brazil produced 4,498,423 bbl/d of oil and 214,968 thousand m³/d of natural gas — 5,850,529 boe/d together. The pre-salt share was 3,728,074 bbl/d and 173,715 thousand m³/d, or 4,820,711 boe/d: 82.4% of national output.
That came from 203 producing wells. The country has 6,724 producing wells: 613 offshore and 6,111 onshore.
Both figures sit in the same ANP monthly bulletin, pages apart, and they are rarely read side by side. Read together they are the governing fact of the Brazilian upstream, and a surprising number of engineering decisions offshore Brazil follow from them.
The arithmetic nobody prints
| Producing wells | Oil (bbl/d) | Average per well (bbl/d) | |
|---|---|---|---|
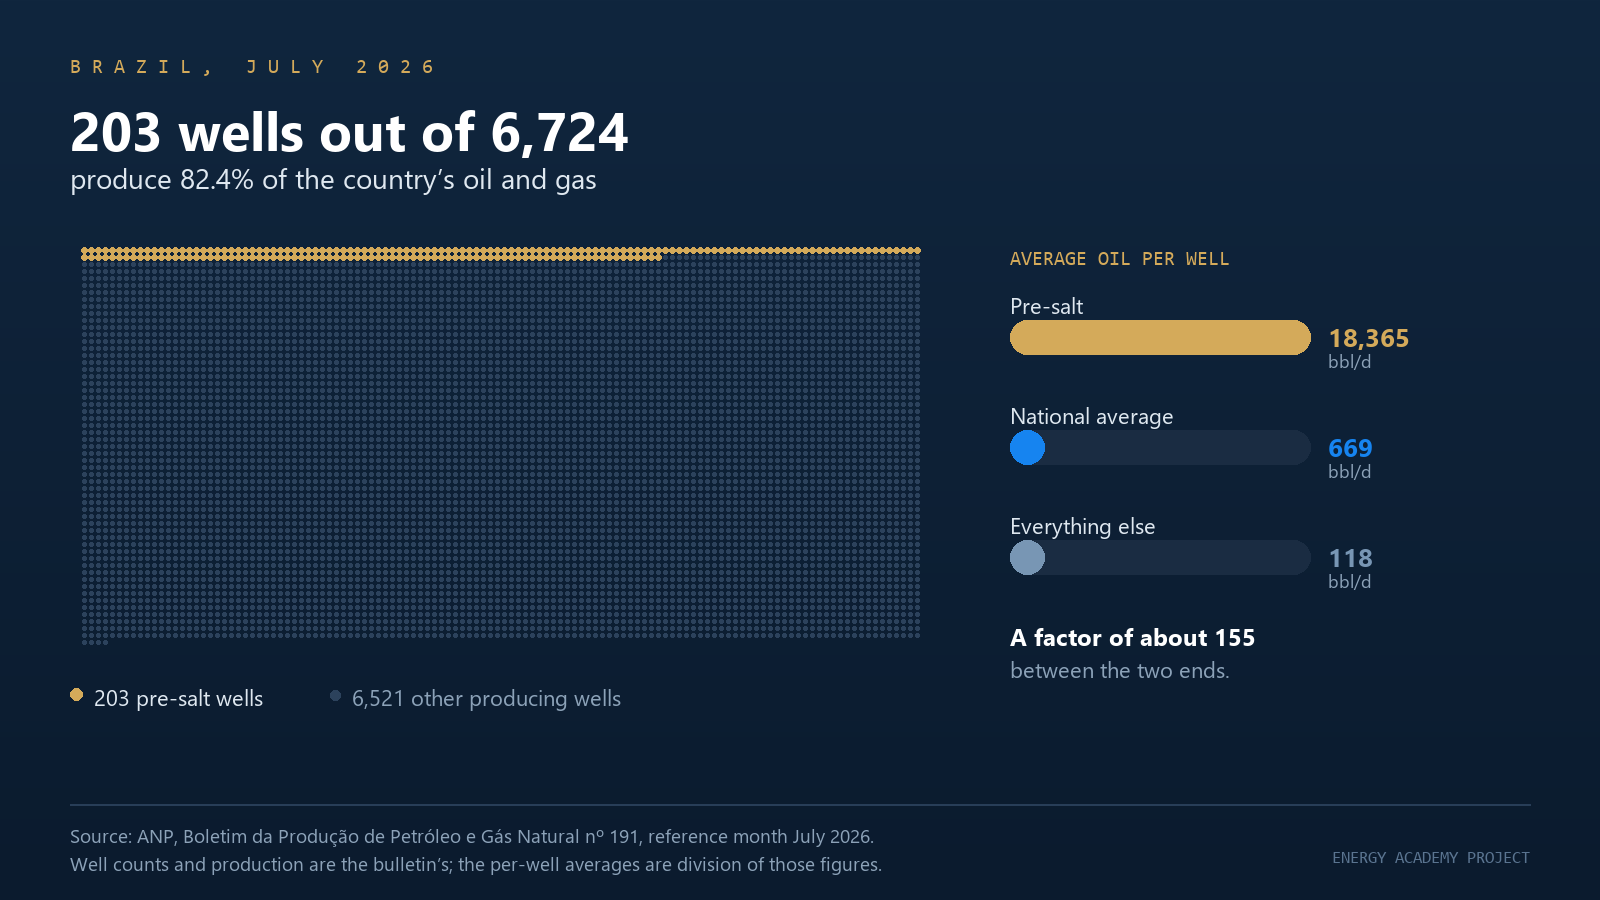
| Pre-salt | 203 | 3,728,074 | 18,365 |
| Everything else | 6,521 | 770,348 | 118 |
| Brazil | 6,724 | 4,498,423 | 669 |
The first and third rows are the bulletin's. The middle row is subtraction, and the per-well column is division; the inputs are not ours to adjust. Counting the associated gas, the pre-salt average rises to 23,747 boe/d per well. The onshore fleet — 6,111 wells producing the 1.9% of national oil that does not come from offshore fields — averages under 15 bbl/d each.
The gap between the two averages is a factor of about 155.
A rate is a productivity index and a drawdown
A producing well is a pressure drop with a coefficient in front of it. Whichever inflow model you prefer, rate scales with a productivity index multiplied by the difference between reservoir pressure and flowing bottomhole pressure. The drawdown term is the one you are not free to expand: it is bounded by near-wellbore rock strength, by the bubble point you do not want to cross in the reservoir, by sand, and by the asphaltene envelope. So an 18,365 bbl/d average is, before anything else, a statement about the productivity index — about permeability-thickness, about skin, and about how much rock the completion actually contacts.
The bulletin reports no reservoir properties, and this post will not invent any. But the direction of the inference is not optional: rates of that order per completion are not available from an ordinary reservoir, and they are the reason a couple of hundred wells can carry a country. The same arithmetic explains the cost structure. Capital is pulled forward into a small number of deep, long, expensive completions instead of being spread across thousands of modest ones, which is why a single well result moves a field plan here and would be noise almost anywhere else.
One caveat matters to anyone sizing equipment from these tables: the bulletin reports oil, not gross liquids. Produced water is not in the figures. Separation and water-treatment duty on the host is larger than the oil number by whatever the water cut is, and the water cut is precisely what the bulletin does not give you.
What it does to the host facility
The highest-producing installation in the country in July 2026 was the FPSO Almirante Tamandaré: 263,178 bbl/d of oil and 11,114 thousand m³/d of gas — 333,085 boe/d — from eight wells. The highest gas producer, the FPSO Marechal Duque de Caxias, made 200,802 bbl/d and 13.60 million m³/d from five wells: 57,272 boe/d per well.
Three consequences follow, and none is optional.
One well is a material fraction of the plant. At eight producing wells per hull, shutting one in removes more than 12% of throughput; at five, a fifth. That changes what an intervention is worth, how hard you argue for a rig slot, how much you are willing to spend on subsea metering to know which well is drifting, and whether you accept a completion design that cannot be re-entered. Redundancy that would be gold-plating on a 40-well platform is ordinary prudence here.
The gas is not incidental. Mero produced 50,926 thousand m³/d of pre-salt gas alongside 763,893 bbl/d of oil — about 67 m³ of gas per barrel. Itapu produced 1,455 thousand m³/d alongside 104,860 bbl/d — about 14. Nearly five to one, and both fields carry the same "pre-salt" label. Gas-oil ratio sets compression train count and power, and once you add the CO₂ content reported for these fields by operators and trade press — figures the ANP bulletin does not publish — it also sets the reinjection duty, the metallurgy and the membrane or amine selection. Nationally the picture is good: 97.8% gas utilisation and 4.67 million m³/d flared, down 29.5% on the month. It is good because the reinjection plant was designed for it.
Flowlines and risers are sized at rates most engineers never meet. Concentrating a third of a million barrels of oil equivalent per day into a handful of tiebacks pushes you against erosional-velocity limits and slug behaviour at the top of the riser, in 1,900 to 2,300 m of water, with the field 150 to 290 km from shore. Cool-down time, hydrate margin and the chemical injection rate over that length are not secondary calculations on this kind of network; they are what decides whether a shutdown is a four-hour event or a four-day one.
Capacity is not production
The same bulletin is the cure for the commonest mistake made with these numbers. The FPSO Bacalhau is rated at 220,000 bbl/d. In July 2026 the Bacalhau and Bacalhau Norte fields together produced 102,461 bbl/d — roughly 47% of the hull's capacity. Nothing is wrong. Ramp-up is a well-by-well curve, not a switch, and with a small well count each new producer is a visible step rather than a smooth trend.
Three ways to misread the same table
Field production is gross. The bulletin reports 100% of the field. An operator's release usually reports that operator's share. The two numbers are different and are not comparable.
A field is not a contract. Four pre-salt fields have production split across two contractual regimes. Búzios is 26.1205% transfer-of-rights and 73.8795% production sharing. Adding "Búzios production" to "production under sharing contracts" counts the same barrel twice.
Pre-salt is not the Santos basin. Ten fields in the Campos basin produce from the pre-salt, and Jubarte produces from both sides of the salt at once — 126,235 bbl/d pre-salt and 65,395 bbl/d post-salt in the same month, through the same infrastructure.
The short version
203 wells, 82.4% of a country. It is an enviable position and a narrow one. Every one of those wells is a single point of failure in a national statistic, which is the real argument for the redundancy, the instrumentation and the flow-assurance conservatism that visitors to these projects sometimes mistake for over-engineering. It is not over-engineering. It is what 18,365 bbl/d per well costs.