The two numbers in the release
On 13 August 2026 the UK regulator published its annual decommissioning update. Its own headline carried two numbers: £2.6 billion spent on UK Continental Shelf decommissioning in 2025 — a basin record, against £2.4 bn in 2024 and £2.0 bn in 2023, in-year prices — and £43.4 billion of estimated remaining cost, down from £43.6 billion a year earlier, each survey in its own year's prices.
Read straight: £2.6 billion spent, outstanding bill down £0.2 billion. The report's own waterfall says why — the forecast is revised upward at every cycle, by more than the year's spend in three of the four: +£3.6 bn against nothing, +£5.4 bn against −£2.0 bn, +£2.6 bn against −£2.4 bn, and last cycle +£2.4 bn against −£2.6 bn. Inflation is one of the causes named.
Our arithmetic on the published figures
This section is subtraction and division performed by us on numbers printed in Figures 15 and 16. The inputs are the regulator's; the differences and percentages are ours.
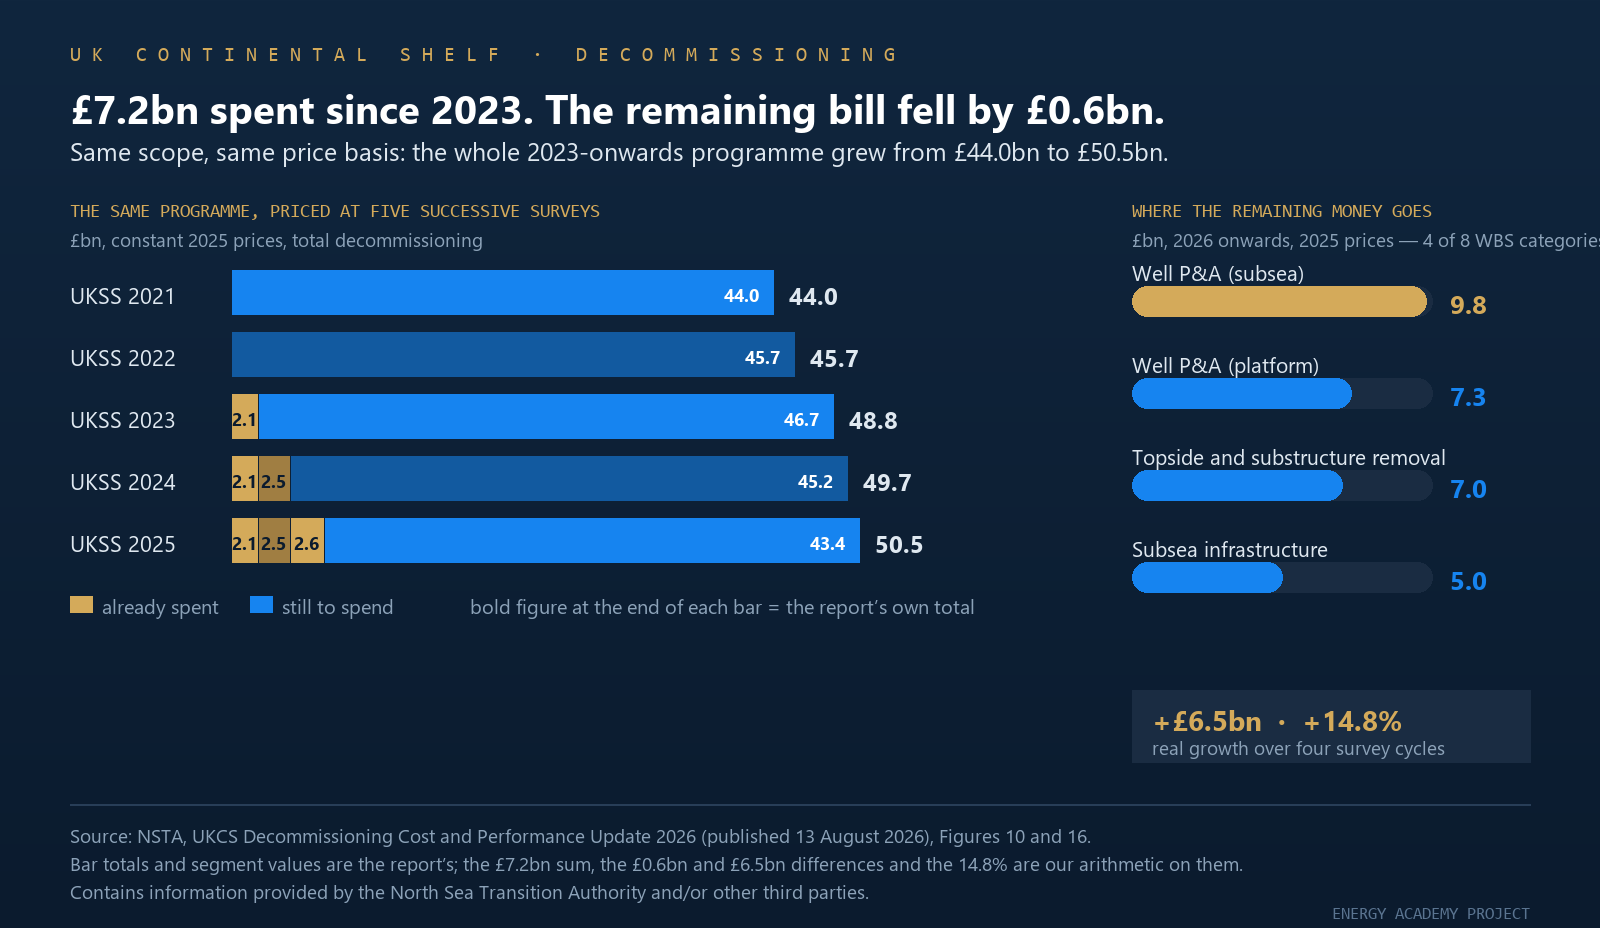
Figure 16 restates the same scope — the whole programme from 2023 onwards — at one price basis (2025 prices), once per annual stewardship survey. The total reads:
£44.0 bn (UKSS 2021) → £45.7 bn → £48.8 bn → £49.7 bn → £50.5 bn (UKSS 2025).
Over the same cycles, spend of £2.1 + £2.5 + £2.6 = £7.2 billion was recorded — Figure 5 prints the same three, labelled — and the remaining forecast moved £44.0 bn → £43.4 bn. The report's "approximately £7 billion" is the in-year sum.
So: £7.2 billion was spent, the remaining bill fell by £0.6 billion, and the programme grew by £6.5 billion — 14.8% — in constant money. Figure 15 shows £36.3 bn → £41.8 bn in 2021 prices, and it has to: both panels rebase one HM Treasury deflator series (30 June 2026 release), so the base year cancels and the 15.2% there is the same number after rounding. Real growth against economy-wide inflation — though a GDP deflator does not remove rig and heavy-lift rates, which the report names among the causes. Scope and rates, not the index.
The report's own caveat: "Comparison against historic NSTA cost estimates is on a full portfolio best estimate basis and not like-for-like per project."
Where the money actually sits
Figure 10 breaks the 2023-onwards programme by WBS, in 2025 prices — totals, with what is still to spend in brackets:
- Well P&A (subsea) — £11.1 bn (£9.8 bn remaining)
- Well P&A (platform) — £9.2 bn (£7.3 bn)
- Topside and substructure removal — £7.4 bn (£7.0 bn)
- Subsea infrastructure — £5.4 bn (£5.0 bn)
- the remaining four categories run from £4.3 bn down to £2.3 bn
Subsea well P&A is the largest single line item in the basin, and the least advanced: about £1.4 bn of its £11.1 bn has been spent in three years. Removals are almost entirely ahead: £7.0 bn of £7.4 bn on topsides and substructures, £5.0 bn of £5.4 bn subsea. Wells took over 50% of spend since 2023 and about 40% of what remains — the balance shifts toward steel, vessels and yards.
Mind the scope label: decom survey only. The eight categories sum to £40.0 bn remaining (our addition) against the £43.4 bn headline, which is total decommissioning and also carries onshore terminals, major pipelines and non-producing fields. Quoting one against the other is a way to be wrong by £3.4 bn.
The backlog is physical
About 3,000 wells remain to be fully plugged and abandoned. Figure 12a profiles them in seven five-year windows running to 2056–2060, and the cumulative Figure 12b ends at 1,989 platform, 1,030 subsea and 81 suspended E&A wells, 3,100 by our addition. The first window, 2026–2030, carries 902 platform, 404 subsea and 60 E&A wells.
Against that: in 2025 operators worked on 257 wells and 114 reached final AB3 status, up from 238 and 103 in 2024. Well abandonment cost £1,273 million in 2025, 49% of all decommissioning spend — the same share as 2024. The backlog awaiting final abandonment is "broadly unchanged" at about 500.
AB3 is a cutting job, not a barrier job
AB2 (derogated): in-well isolation complete, with derogation granted or pending to leave the well origin or the equipment above it, such as the conductor. AB3: in addition to the permanent barriers, "the well origin and all conductor equipment associated with the well origin have been removed."
That last step is not a pressure-containment operation. It is severance and lift at the seabed — and the regulator's stated aim is to "release valuable rig capacity for earlier-stage well abandonment work". The wellhead severance charter signed by the regulator and 17 operators in August 2026 is careful to stay neutral on the means, "including both vessels and rigs"; it "is not intended to have binding legal effect", and commits signatories to a workgroup, to data sharing and to early supply chain engagement.
The numbers for the prize: roughly 1,000 subsea wells left, £700,000 average per wellhead removal over five years on a sample of more than 100 wells, and a 30%, or about £200 million, reduction if vessels replace rigs — assuming every wellhead is removed and excluding inflation. Our check: 1,000 × £700,000 × 30% = £210 million, so £200 million is rounded down. It is also about 0.5% of the £43.4 bn (our division). The prize is not the money — it is the rig-weeks released for barrier work that only a rig can do.
The constraint is the fleet
Six semi-submersibles are marketed in the UKCS, down from a peak of eleven in 2023 — the NSTA's figure, sourced in its appendix to Westwood Global Energy, July 2026. The same units are wanted for production-adding interventions and for CCS drilling. The report also records a "marked increase in the cost of large (> 3kTe) removals of jackets and topsides", attributed to global demand for heavy lift vessels. Decommissioning is forecast to overtake capital expenditure from 2029, taking 24% of UK upstream spend in 2026–2031 against 13% in 2021–2025.
What we could not confirm
- Appendix 1, Figure 17 forecasts removal quantities, tonnage and kilometres for 2026–2037 in seven panels, with no data labels — we quote nothing from it.
- Figures 8a and 8b (operator concentration) carry no values in the PDF text layer. That one operator now accounts for 17% of the decade's expenditure and the top 10 for more than 80% comes from the body text; the report does not name them, and neither do we.
- The Benchmarking Report 2026 is an interactive application we did not read; its ">1,280 wells" scope and the cited saving of over £250,000 per well on an eight-well campaign are the regulator's.
What to watch
- The rate gap. The 2026–2030 window holds 1,366 inactive wells (our sum of the three categories); 114 reached AB3 in 2025. Either the rate multiplies or the profile slides right.
- Whether severance actually moves to vessels. A non-binding charter is worth one campaign: the test is a multi-operator vessel campaign with a published unit cost.
- The next survey's "change in forecast" term. In three of four cycles it exceeded that year's spend; in the fourth it fell £0.2 bn short — and that £0.2 bn is the whole fall in the headline.
- CCS-driven P&A scope. Under net zero, reuse and repurposing, the risk register flags wells that may need decommissioning to a higher standard to enable CCS — "additional intermediate barriers and or intersect wells". A different well design, decided long before the rig arrives.